
HospitalIQ
The site at a glance, and where escalation sits.
The problem this solves Site-level questions get answered by a round of phone calls. How the site is standing, how each ward is standing, and what escalation level that actually adds up to — by the time it has been assembled by hand, it describes an hour ago.
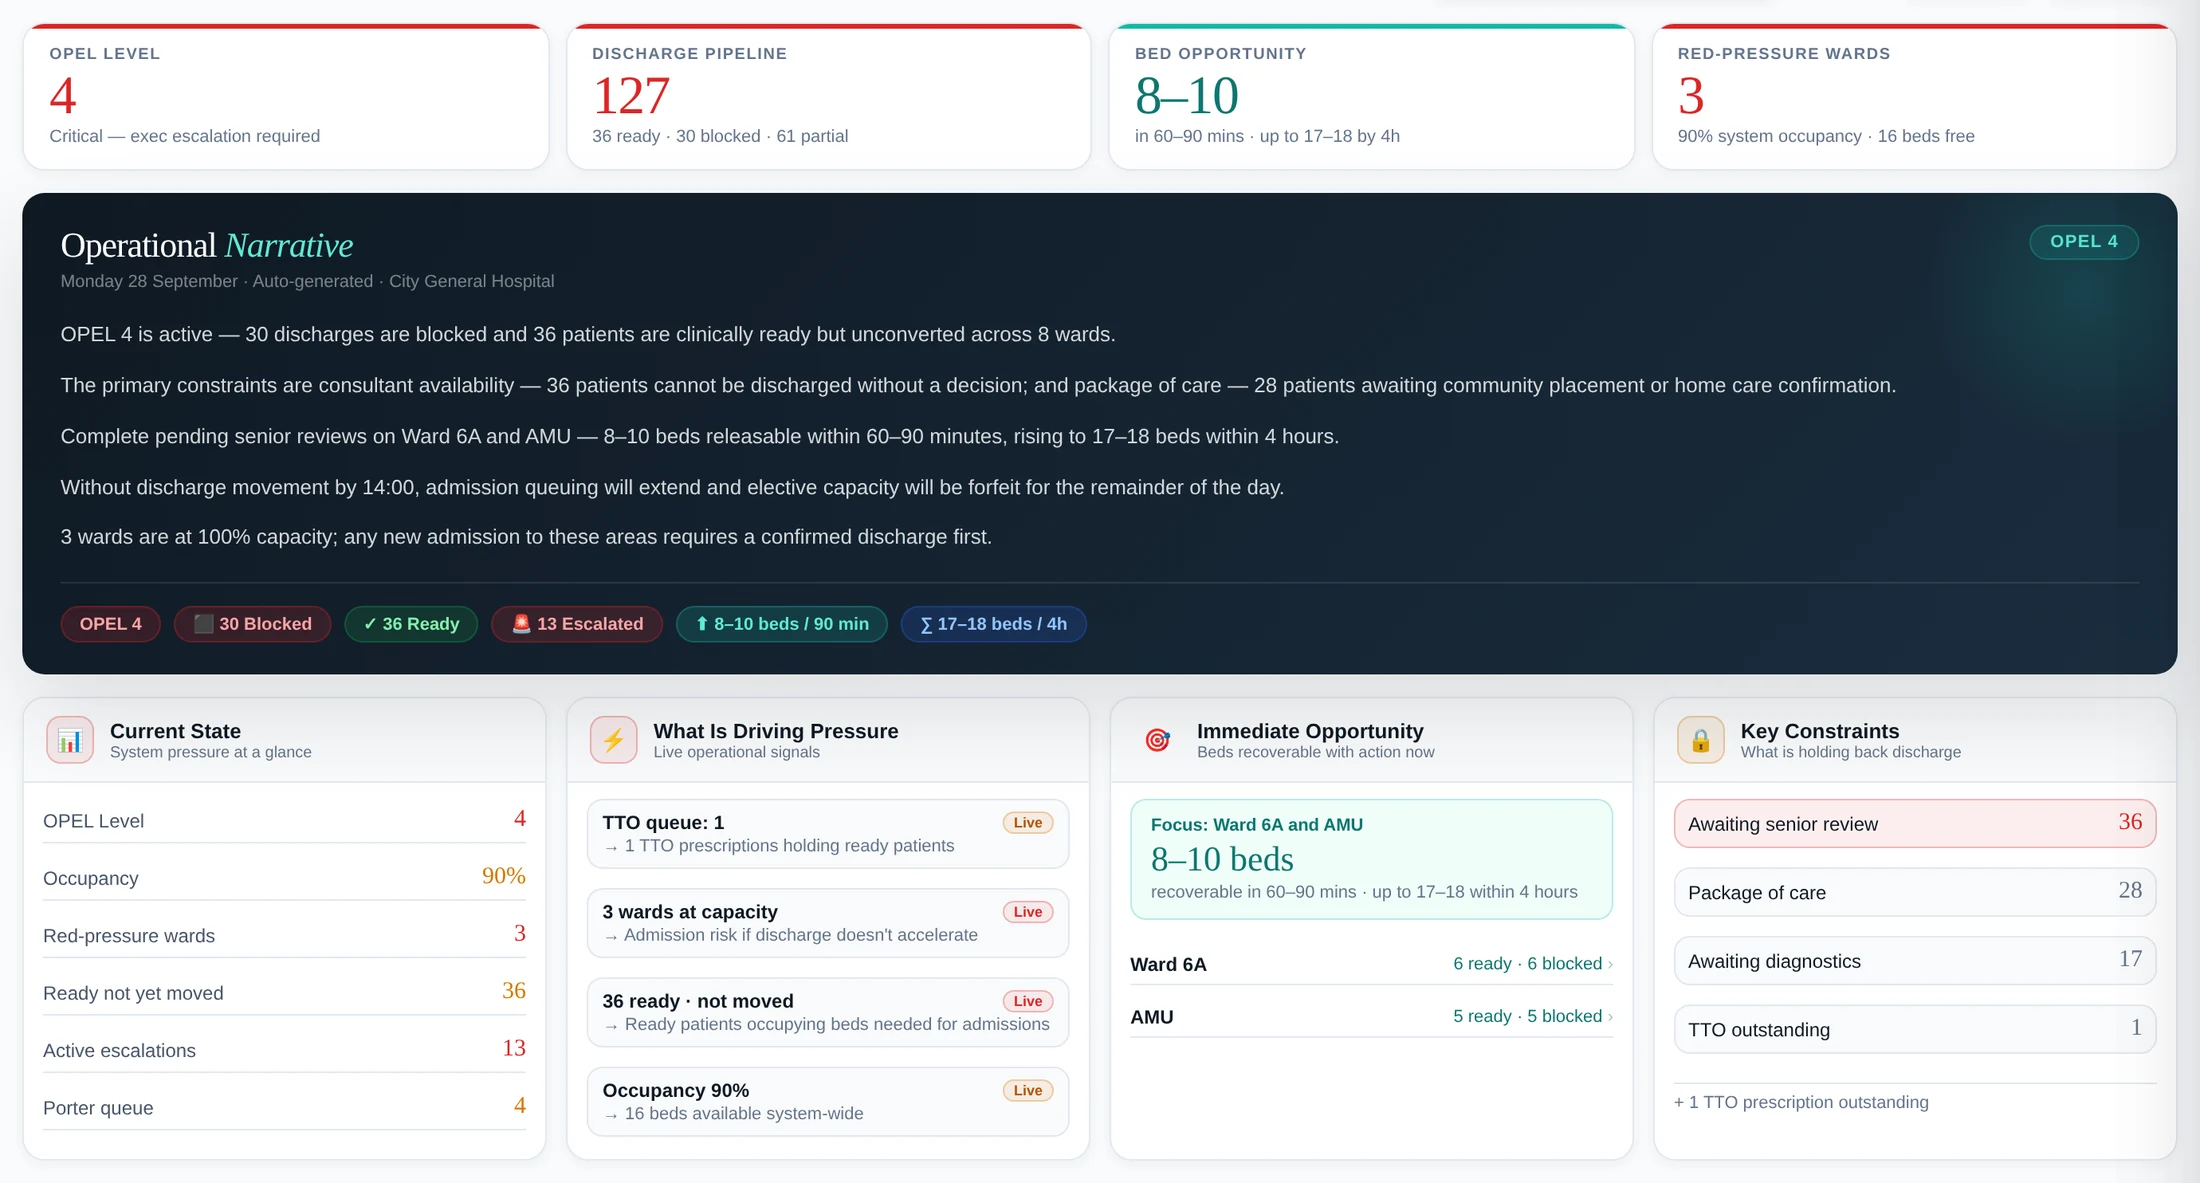

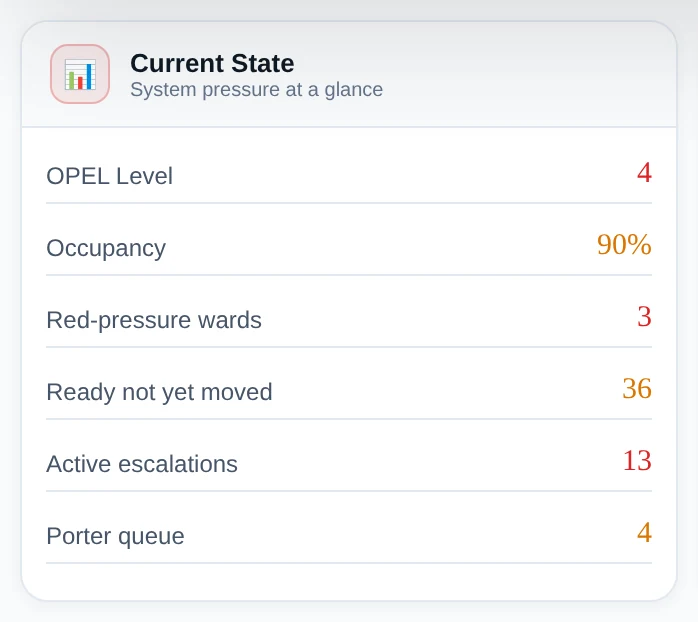
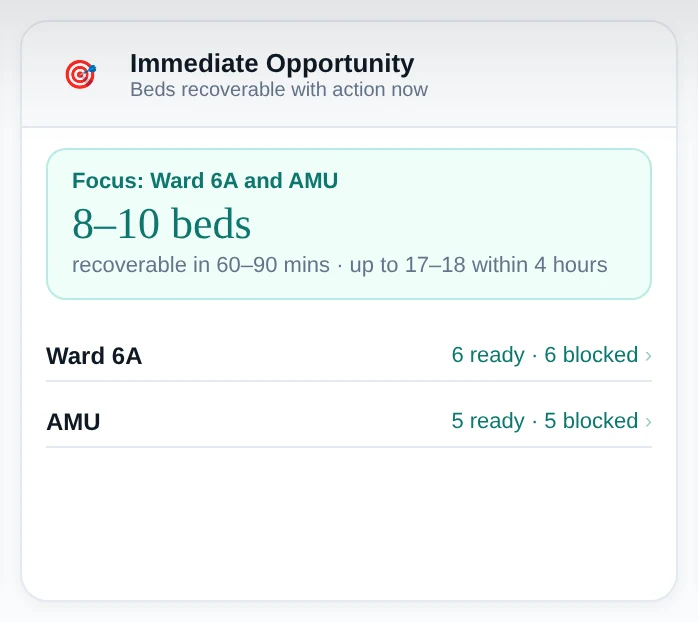
HospitalIQ gives site and operational teams the counts that describe the day: the site, the wards within it, and the escalation level those counts point to. It is the overview, not the detail — when a ward needs looking at patient by patient, that is WardIQ.
Why it matters
- Know the site’s position without a round of calls
The escalation level and the counts behind it, in one place and current.
- See pressure building earlier
Which wards and areas are driving the position, before it becomes an escalation.
- Go from overview to action
One step from a site count to the ward, and the patients, behind it.

See how HospitalIQ would work in your service
Thirty minutes, built around the operational problem you are trying to solve rather than a tour of the software. Tell us what is getting in the way and we will show you the part of PA-IQ that speaks to it.
Typically live within 12 weeks of data access being agreed. Available through Insight, Softcat and Computacenter. We will only use your details to reply to you.